Central Toronto Real Estate TREB Released December, 2018 Resale Market Figures
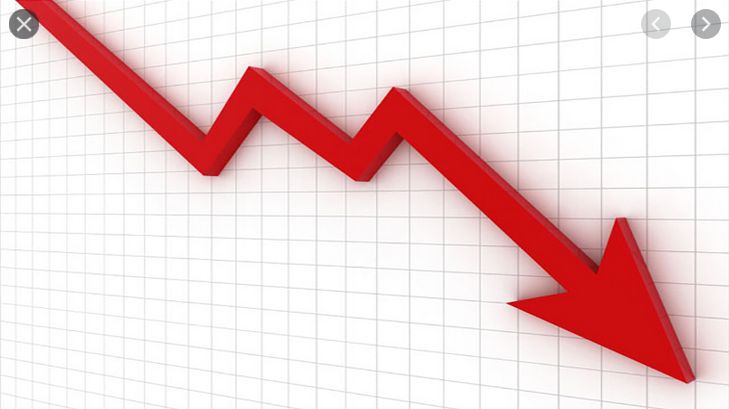
Toronto Real Estate Board announced that Greater Toronto Area REALTORS® reported a total of 77,426 residential transactions through TREB’s MLS® System in 2018. This result represented a 16.1 per cent decline compared to 92,263 sales reported in 2017. Total new listings entered into TREB’s MLS® System were down by 12.7 per cent over the same period to 155,823.
The overall average selling price for 2018 transactions, at $787,300, was down by 4.3 per cent year-over-year for all home types combined across the TREB market area.
Home prices were up very slightly in the City of Toronto and down in the surrounding GTA regions. This dichotomy reflects the fact that the condominium apartment segment, which accounted for a large proportion of sales in the City of Toronto, performed better from a pricing perspective than the detached market segment. The average price for condominium apartment sales across the TREB market area was up by 7.8 per cent year-over-year.
“Higher borrowing costs coupled with the new mortgage stress test certainly prompted some households to temporarily move to the sidelines to reassess their housing options. With this said, it is important to note that market conditions were improved in the second half of the year, both from a sales and pricing standpoint,” said Garry Bhaura, TREB President.
“After spiking in 2017, new listings receded markedly in 2018. In many neighbourhoods, despite fewer sales from a historic perspective, some buyers still struggled to find a home meeting their needs. The result was a resumption of a moderate year-over-year pace of home price growth in the second half of the year. Price growth was strongest for less-expensive home types, as many home buyers sought more affordable home ownership options,” said Jason Mercer, TREB’s Director of Market Analysis and Service Channels.
| Summary of TREB MLS® Sales and Average Price December 1 – 31, 2018 | ||||||
| 2018 | 2017 | |||||
| Sales | Average Price | New Listings | Sales | Average Price | New Listings | |
| City of Toronto (“416”) | 1,473 | 762,627 | 1,426 | 1,953 | 740,721 | 2,133 |
| Rest of GTA (“905”) | 2,308 | 742,237 | 2,882 | 2,923 | 730,922 | 4,156 |
| GTA | 3,781 | 750,180 | 4,308 | 4,876 | 734,847 | 6,289 |
| TREB MLS® Sales & Average Price By Home Type December 1 – 31, 2018 | ||||||
| Sales | Average Price | |||||
| 416 | 905 | Total | 416 | 905 | Total | |
| Detached | 340 | 1,250 | 1,590 | 1,145,892 | 891,095 | 945,580 |
| Yr./Yr. % Change | -24.1% | -14.8% | -17.0% | -8.0% | -2.2% | -4.4% |
| Semi-Detached | 116 | 226 | 342 | 939,859 | 661,186 | 755,707 |
| Yr./Yr. % Change | -32.6% | -26.6% | -28.8% | 4.0% | 3.9% | 3.2% |
| Townhouse | 162 | 455 | 617 | 714,456 | 591,851 | 624,042 |
| Yr./Yr. % Change | -18.2% | -31.1% | -28.1% | 10.0% | 2.9% | 5.3% |
| Condo Apartment | 848 | 337 | 1,185 | 594,381 | 454,135 | 554,497 |
| Yr./Yr. % Change | -23.9% | -21.8% | -23.4% | 11.4% | 5.8% | 9.9% |
| Seasonally Adjusted TREB MLS® Sales and Average Price1 | ||||
| Sales | Month-over-Month % Chg. | Average Price | Month-over-Month % Chg. | |
| December ’17 | 8,690 | 11.8% | $783,611 | 0.8% |
| January ’18 | 6,660 | -23.4% | $769,509 | -1.8% |
| February ’18 | 6,100 | -8.4% | $746,897 | -2.9% |
| March ’18 | 6,040 | -1.0% | $752,402 | 0.7% |
| April ’18 | 5,916 | -2.1% | $752,203 | 0.0% |
| May ’18 | 5,684 | -3.9% | $762,728 | 1.4% |
| June ’18 | 6,554 | 15.3% | $786,914 | 3.2% |
| July ’18 | 6,917 | 5.5% | $808,044 | 2.7% |
| August ’18 | 6,986 | 1.0% | $805,637 | -0.3% |
| September ’18 | 6,945 | -0.6% | $802,976 | -0.3% |
| October ’18 | 6,844 | -1.5% | $808,794 | 0.7% |
| November ’18 | 6,615 | -3.3% | $804,725 | -0.5% |
| December ’18 | 6,649 | 0.5% | $796,813 | -1.0% |
| December 2018 Year-Over-Year Per Cent Change in the MLS® HPI | ||||||||||||
| Composite (All Types) | Single-Family Detached | Single-Family Attached | Townhouse | Apartment | ||||||||
| TREB Total | 2.98% | 0.16% | 1.85% | 3.97% | 8.96% | |||||||
| Halton Region | 3.06% | 3.01% | 3.88% | 3.24% | 0.87% | |||||||
| Peel Region | 4.05% | 2.23% | 3.56% | 2.50% | 10.79% | |||||||
| City of Toronto | 6.41% | 1.13% | 3.93% | 6.78% | 10.21% | |||||||
| York Region | -3.50% | -4.72% | -4.00% | -2.20% | 4.52% | |||||||
| Durham Region | 0.52% | 0.22% | 1.82% | 2.71% | -0.86% | |||||||
| Orangeville | 5.03% | 5.05% | 4.59% | – | – | |||||||
| South Simcoe County1 | -0.50% | -0.55% | -0.49% | – | – | |||||||
| 1South Simcoe includes Adjala-Tosorontio, Bradford West Gwillimbury, Essa, Innisfil and New Tecumseth | ||||||||||||
|
Annual Summary of TREB MLS® Sales and Average Price |
||||||||||||
| Year-to-Date | ||||||||||||
| 2018 | 2017 | |||||||||||
| Sales | Average Price | New Listings | Sales | Average Price | New Listings | |||||||
| City of Toronto (“416”) | 29,863 | 835,422 | 51,599 | 35,148 | 834,250 | 59,505 | ||||||
| Rest of GTA (“905”) | 47,563 | 757,086 | 104,224 | 57,115 | 815,386 | 118,906 | ||||||
| GTA | 77,426 | 787,300 | 155,823 | 92,263 | 822,572 | 178,411 | ||||||
| Annual TREB MLS® Sales & Average Price By Home Type | ||||||
| Calendar Year 2018 | ||||||
| Sales | Average Price | |||||
| 416 | 905 | Total | 416 | 905 | Total | |
| Detached | 7,906 | 25,631 | 33,537 | 1,320,333 | 913,668 | 1,009,535 |
| Yr./Yr. % Change | -16.3% | -19.4% | -18.7% | -7.1% | -8.9% | -8.1% |
| Semi-Detached | 2,569 | 4,639 | 7,208 | 1,001,438 | 658,579 | 780,777 |
| Yr./Yr. % Change | -11.5% | -15.9% | -14.4% | 1.0% | -2.2% | -0.3% |
| Townhouse | 2,899 | 9,728 | 12,627 | 741,437 | 606,860 | 637,757 |
| Yr./Yr. % Change | -11.2% | -11.7% | -11.5% | 2.7% | -2.1% | -0.9% |
| Condo Apartment | 16,296 | 6,554 | 22,850 | 593,366 | 450,620 | 552,423 |
| Yr./Yr. % Change | -15.4% | -13.5% | -14.9% | 8.7% | 5.4% | 7.8% |
| Source: Toronto Real Estate Board; CREA Seasonal Adjustment |

Source: Toronto Real Estate Board
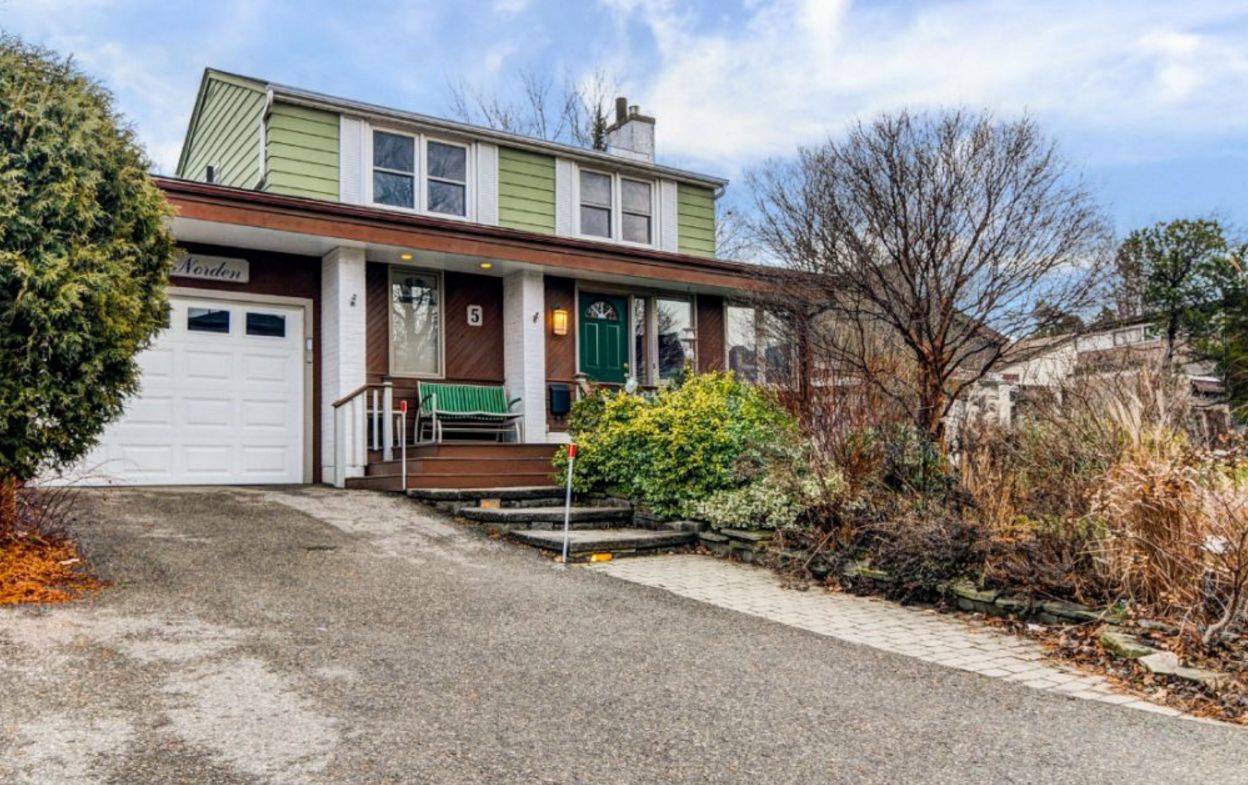
Thinking to sell your house or Condo in Central Toronto areas and/or in downtown Toronto areas? Please call, text or email Max Seal, Broker at 647-294-1177. Please visit http://www.TorontoHomesMax.com for a FREE Home Evaluation“.
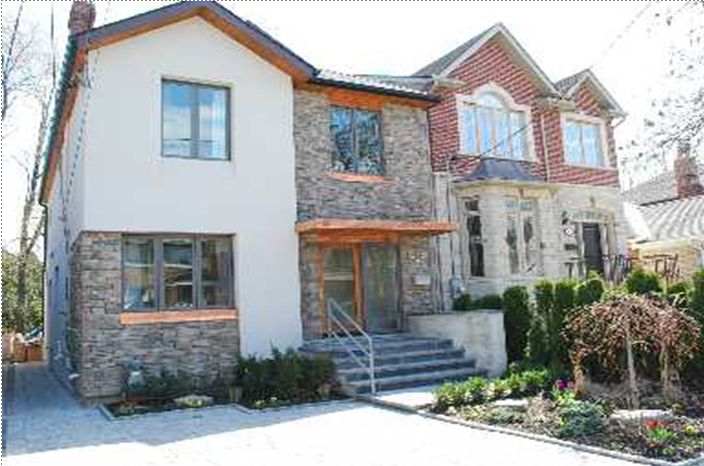
Thinking to buy a House or Condo in Central Toronto areas and/or in Downtown Toronto areas? please call or text Max Seal, Broker at 647-294-1177 to buy your dream home or Condo. I offer you a 30-min “FREE buyer’s consultation” with NO obligation.
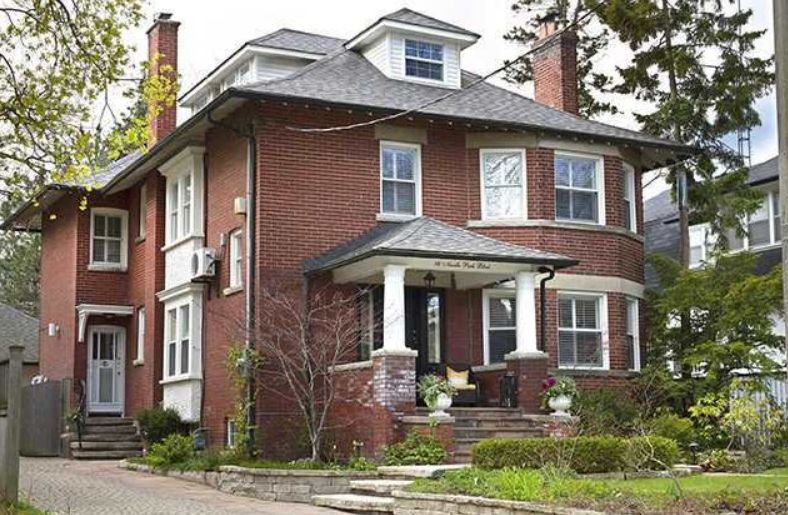
Please visit my website http://www.centraltorontorealestate.com/ to find out available homes and Condos for sale in Central Toronto areas and/or in downtown Toronto areas.
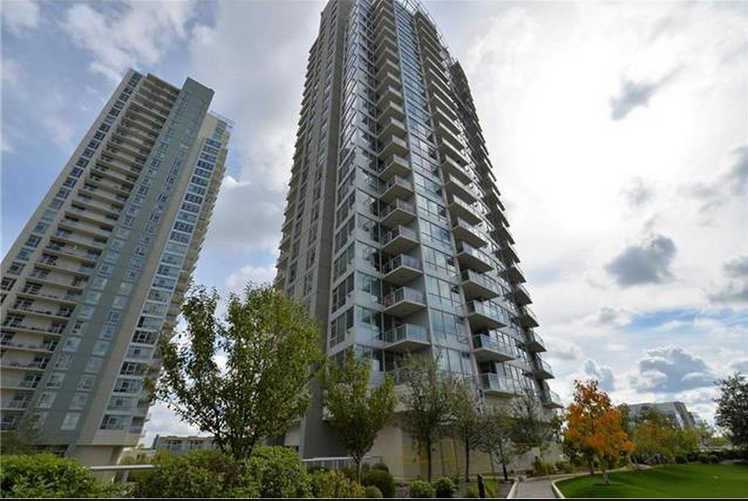
This Toronto housing market may be a better time for “Move-up”, “Move-down” or “Empty-nester” Sellers and Buyers. Want a “Market Update” of your home in 2018? Please click the image below or call or text Max Seal, Broker at 647-294-1177 or send an email.